
From 1 January 2023, the Group has been re-organised into three operating segments representing the key markets within which the Group operates, as reviewed by the Board: Energy, Defence, and Maritime Transport. The Energy Division combines the old Marine Support and Offshore Oil Divisions, minus Fendercare (which includes Martek), which is added to the Tankships Division to create Maritime Transport. Specialist Technical (the JFD business) is the only component of the Defence Division. Energy and Defence are differentiated by markets and industries which they serve. The Maritime Transport Division is differentiated by the services which they provide. Further information can be found in the Group’s Annual Report.
|
June 2023 £m |
2022 £m |
2021 £m |
Restated* 2020 £m |
Restated* 2019 £m |
|
| Revenue | |||||
| Energy1 | 134.0 | 242.6 | 222.9 | 222.9 | 272.2 |
| Defence | 37.0 | 68.2 | 81.5 | 83.2 | 106.3 |
| Maritime Transport | 81.0 | 167.3 | 138.0 | 164.9 | 192.2 |
| Total Revenue (continuing operations) | 252.0 | 478.1 | 442.4 | 471.0 | 570.7 |
| Underlying Operating Profit | |||||
| Energy2 | 7.5 | 13.9 | 7.7 | (1.8) | 15.0 |
| Defence | 0.6 | (0.3) | 9.7 | 13.2 | 18.2 |
| Maritime Transport | 10.0 | 18.7 | 13.5 | 31.4 | 36.9 |
| Corporate costs | (4.1) | (5.9) | (2.8) | (2.8) | (2.8) |
| Total Underlying Operating Profit (Continuing operations) | 14.0 | 26.4 | 28.1 | 40.0 | 67.3 |
*2019 and 2020 results are restated to exclude the nuclear business which was subsequently reported as a discontinued operation.
1Sales relating to divestments (Mimic, Prolec, Strainstall, Testing Services, NDT):
2019: £25.4m
2020: £18.9m
2021: £16.1m
2022: £14.1m
2Operating Profit/(loss) relating to divestments (Mimic, Prolec, Strainstall, Testing Services, NDT):
2019: £0.2m
2020: (£1.0m)
2021: £1.1m
2022: £2.3m
Sign up to regulatory news services (RNS) alerts from James Fisher and Sons plc (LSE: FSJ).
Our latest news
Discover the latest stories from across James Fisher
 Read article
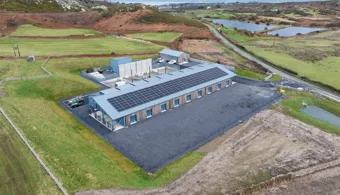
James Fisher secures its first tidal energy project in Anglesey, UK
Read article
James Fisher secures commissioning contract worth over one million pounds at Zhong Neng offshore wind farm in Taiwan
Read article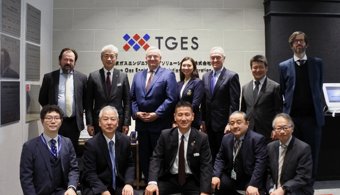
James Fisher and Tokyo Gas Engineering Solutions sign a Joint Collaboration Agreement to deliver offshore wind Operations and Maintenance services in Japan
Read article
Full Year Trading Update for Year Ended 31 December 2023
Read article
Appointment of Independent Non-Executive Director
Read articleJFD secures contract with TechnipFMC enhancing portable hyperbaric rescue capability and global support of diver safety
Read article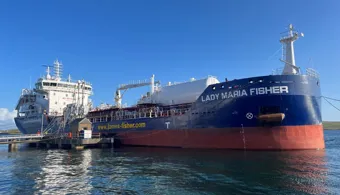
James Fisher christens Lady Maria Fisher in vessel naming ceremony at Port of Sunderland
Read article



 Annual Report 2023